WOW: Before you start doing any editing like this BACK UP BACK UP BACK UP. Because if it goes wrong it can really F*#@$">F*#@$ your system.
Step 1: Copy the linetime.cxml file to linetimescatter.cxml. This file can ussaly be found in ..\OracleBI\web\app\res\s_oracle10\charts
Step 2: Copy the timeline.pcxml to timelinescatter.pcxml. This file can ussaly be found in ..\OracleBI\web\app\res\s_oracle10\popbin
Step 3: In the custommessages folder for the language add the following to the custommessages.xml file (create the folder and file if they don't exsist!)


Step 4: Edit the linetimescatter.cxml file
set displaynameref="kmsgChartTimeSeriesScatter"
set sawc:engineSpecific file="popbin/timelinescatter.pcxml"
Save and close the file
Step 5: Edit the timelinescatter.pcxml file
set Graph Name="graph" Type="Time" SubType="Scatter"
Save and close the file
Step 6:
restart the Java-host and the prestationserver.

Till Next Time
Hi John,
ReplyDeletei want to display tool tip for level axis in a scattered graph as like hovering over a point it is displaying the X and Y axis value , in the same way i want the actual value of column which has been taken in level axis.
Thanks
Naresh Meda
@Naresh,
ReplyDeleteHave a look here:
http://obiee101.blogspot.com/2008/01/obiee-xy-and-data-in-mouse-over-label.html
regards
john
Hi Jhon,
ReplyDelete%_SERIES_NAME gives us the legend axis value . when i put %_CATEGORY_NAME i did not get any value in the chart rather it showed the text like Z = %_CATEGORY_NAME . Is there any syntax to follow. All other options are not for all the graph . Could you please help me out.
Thanks
Naresh
@Naresh
ReplyDeleteDid you try %_XVALUE, %_YVALUE , %_BUBBLE_VALUE
regards
john
Hi John,
ReplyDeleteyes , i tried . but it is not for scattered graph . it's for bubble graph . Still then i tried with that and it displays 0 always.
Thanks
Naresh
@Naresh
ReplyDeleteDid you check the docs in:
{OracleBI}corda50\docs
regards
John
Hi John,
ReplyDeletei went through all the available document but did not get any solution
Thanks
Naresh
Hi John
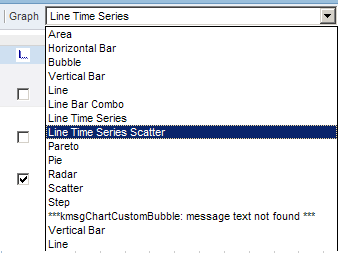
ReplyDeleteI followed your instructions but in the drop down list i keep getting:
*** kmsgChartTimeSeriesScatter: message text not found ***
any idea on what maybe wrong?
Thanks
@Chris,
ReplyDeleteCheck for typo's and Capitals!
Restart the presentation server and javahost.
regards