Showing posts with label PIVOT. Show all posts

Monday, September 5, 2011

OBIEE Calendar Control

image

Question from the OTN Forum. (Works in 10 & 11g)

Select a YearMonth, YearWeek and Date from your Calendar dimension, select a measure from your facts.

Add a extra column called “Day Of the Week”

CAST(DAYOFWEEK("Time"."T00 Calendar Date") as varchar(2)) || ' - '||DAYNAME("Time"."T00 Calendar Date")

Alter your fact column to:

'<b>'||cast("Time"."T00 Calendar Date" as varchar(10))||'</b>'||'<br><P STYLE="text-align: right;">'||CAST("Base Facts"."1- Revenue" AS varchar(15))

It concats the date with the fact and adds some HTML Formatting

Alter the column properties [data format] to HTML:

image

Put it all in a pivot view:

image

Check the results:

image

Till Next Time

Monday, June 28, 2010

OBIEE dynamic pivot calculations

In http://obiee101.blogspot.com/2009/01/obiee-rowbased-calculations-in-pivot.html I showed you how can make make your own calculations in a pivot table. But what if you want to make it more dynamic? Consider this: The forecast is .4 * q1  + .6 * q3.
If we do it the “hardcoded” way we get:
image
This works fine:
image
But if we switch to 2008:
image
we loose the forecast.
you can make it dynamic by chancing the “hard-coded” row or column names to dynamic ones using the dollar sign $:
image
Now you always have a forecast:
image and image

Andreas made a smart remark:


Just for completion I would add the fact that $1 stands for the first element of the request. And as a warning (Wow) that the sorting there is determined by the request and not by the constellation in the pivot-table. Because this can cause some people to search around quite long, for example if you change the sorting in the request OBIEE will add up different quarters than before etc.


Till Next Time
PS @eejimkos it works fine in al my browsers:
Firefox:
image
IExplorer:
image
Chrome:
image

Saturday, February 6, 2010

OBIEE Pivot Conditional Format Grand Total Part 2

In this OTN forum discussion (http://forums.oracle.com/forums/thread.jspa?messageID=4025463&#4025463) JavaSript master Joe and OBIEE Crack Raghu show us two separate ways of making a conditional format for the grand total on a table.
Raghu’s way editing XML:
Let’s start with a basic table:
image
Make a Pivot:
image
Put it on a Compound Layout:
image
On the basic table add a conditional format on a random column:
image
Open the advanced tab:
image
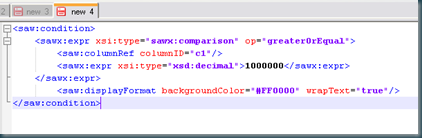
locate the saw:condition part :
<saw:condition>
    <sawx:expr xsi:type="sawx:comparison" op="greaterOrEqual">
        <saw:columnRef columnID="c1"/>
        <sawx:expr xsi:type="xsd:decimal">1000000</sawx:expr>
    </sawx:expr>
        <saw:displayFormat backgroundColor="#FF0000" wrapText="true"/>
</saw:condition>
Copy and paste this into an good! XML Editor (fi Notepad ++)
image
Remove the condition from your bas table:
image
Go back to the advanced tab:
image
Copy and paste all XML into your XML EDITOR:
image
Locate the Pivot View part:
image
Copy you condition into the column part just below the labels between saw:totalValue and saw:displayFormats tags
image
Copy the XML back to OBIEE, don’t forget to press the SET XML tag:
image
There you go:
image
Although this method of Raghu is very elegant I personally prefer Joe method discussed in part 1. With XML Editing you run into the risk of loosing your stuff when make a change in your report easily, also most user won’t have access to the Advanced TAB.
Till Next Time

Saturday, January 30, 2010

OBIEE Horizontal Pivot Sections Part 2

Based on this post: http://obiee101.blogspot.com/2010/01/obiee-horizontal-pivot-sections.html I was asked if this was possible:

image

Or a “carriage return” every x columns. So extra lines to Joe’s code fixed it:

    <script type="text/javascript">
    /* based orignal code by Joe Betram
    /* see:http://forums.oracle.com/forums/thread.jspa?threadID=1009297&tstart=0
    /* This Version John Minkjan :http://www.obiee101.blogspot.com/
    /* Thanks to Nandoo for noticing the IE bug
    */
    /* Set the number of columns */
    var intColumnNumbers = 5;

    function insertAfter( referenceNode, newNode )
    {
        referenceNode.parentNode.insertBefore(newNode, referenceNode.previousSibling);
    }
    var debug =1;
    var sectioncnt =0;
    var x =0;

    if (debug === 1) { document.write("Get all tables"+"<BR>");}
    var tables = document.getElementsByTagName('table');

    if (debug === 1) { document.write("Loop over the tables"+"<BR>");}
    for(var table=0; table < tables.length; table++){

    if(tables[table].className != 'PTSectsTable' ){
    continue;
    }

    if (debug === 1) { document.write("Found a pivot table"+"<BR>");}

    var tbody = tables[table].getElementsByTagName('tbody')[0];
    if (debug === 1) { document.write("Grabbed the tbody code"+"<BR>");}

    var trs = tbody.getElementsByTagName('tr');

    var new_tr = document.createElement('tr');
    var nw_tr =new Array();
    nw_tr[x] = document.createElement('tr');
    if (debug === 1) { document.write("Created the new_tr variable"+"<BR>");}

    while( trs.length > 0){

    var new_td = document.createElement('td');
    if (debug === 1) { document.write("Created a new TD element."+"<BR>");}

    var new_table = document.createElement('table');
    if (debug === 1) { document.write("Created a new table element."+"<BR>");}

    var new_tbody = document.createElement('tbody');
    if (debug === 1) { document.write("Created a new tbody element."+"<BR>");}

    new_tbody.appendChild(trs[0]);
    if (debug === 1) { document.write("Appended Section."+"<BR>");}

    new_tbody.appendChild(trs[0]);
    if (debug === 1) { document.write("Appended Data."+"<BR>");}

    new_table.appendChild(new_tbody);
    if (debug === 1) { document.write("Appended tbody to the table tag."+"<BR>");}

    new_td.appendChild(new_table);
    if (debug === 1) { document.write("Appended table to the TD tag."+"<BR>");}

    new_tr.appendChild(new_td);
    if (debug === 1) { document.write("Appended td to the overall TR tag."+"<BR>");}
    /*nw_tr[0].appendChild(new_td);*/
    sectioncnt = sectioncnt +1;
    if (debug === 1) { document.write(sectioncnt%intColumnNumbers+"<BR>");}

    if (sectioncnt%intColumnNumbers ===0){        
        nw_tr[x]=new_tr;
        var new_tr = document.createElement('tr');
        x =x+1;
    };
    }
    var y=0;
    for (y=0; y<nw_tr.length; y++)
    {
        tbody.appendChild(nw_tr[y]);
    }
    tbody.appendChild(new_tr);
    if (debug === 1) { document.write("Inserted the new_tr variable as the first child of tbody"+"<BR>");}
    }

    if (debug === 1) { document.write("Finished transposePivotTable"+"<BR>");}

    </script>

Till Next Time

Friday, January 22, 2010

OBIEE Horizontal Pivot Sections

From this: image to this:

image

Java script master Joe Betram showed us the way: http://forums.oracle.com/forums/thread.jspa?threadID=1009297&tstart=0 

Simple add a static text to your report:

image

Add Joe’s code:

<script type="text/javascript">
/* orignal code by Joe Betram
/* see:http:/*forums.oracle.com/forums/thread.jspa?threadID=1009297&tstart=0
*/
var debug =0;

if (debug === 1) { document.write("Get all tables"+"<BR>");}
var tables = document.getElementsByTagName('table');

if (debug === 1) { document.write("Loop over the tables"+"<BR>");}
for(var table=0; table < tables.length; table++){

if(tables[table].className != 'PTSectsTable' ){

continue;
}

if (debug === 1) { document.write("Found a pivot table"+"<BR>");}

var tbody = tables[table].getElementsByTagName('tbody')[0];
if (debug === 1) { document.write("Grabbed the tbody code"+"<BR>");}

var trs = tbody.getElementsByTagName('tr');

var new_tr = document.createElement('tr');
if (debug === 1) { document.write("Created the new_tr variable"+"<BR>");}

while( trs.length > 0){

var new_td = document.createElement('td');
if (debug === 1) { document.write("Created a new TD element."+"<BR>");}

var new_table = document.createElement('table');
if (debug === 1) { document.write("Created a new table element."+"<BR>");}

var new_tbody = document.createElement('tbody');
if (debug === 1) { document.write("Created a new tbody element."+"<BR>");}

new_tbody.appendChild(trs[0]);
if (debug === 1) { document.write("Appended Section."+"<BR>");}

new_tbody.appendChild(trs[0]);
if (debug === 1) { document.write("Appended Data."+"<BR>");}

new_table.appendChild(new_tbody);
if (debug === 1) { document.write("Appended tbody to the table tag."+"<BR>");}

new_td.appendChild(new_table);
if (debug === 1) { document.write("Appended table to the TD tag."+"<BR>");}

new_tr.appendChild(new_td);
if (debug === 1) { document.write("Appended td to the overall TR tag."+"<BR>");}
}

tbody.appendChild(new_tr);
if (debug === 1) { document.write("Inserted the new_tr variable as the first child of tbody"+"<BR>");}
}

if (debug === 1) { document.write("Finished transposePivotTable"+"<BR>");}

</script>

Don’t forget to press the SET XML button before you save it!


Till Next Time

Tuesday, September 22, 2009

OBIEE Tooltip Text in Column Heading

On the forums every now and then the question on how to achieve this:
image
comes along, and most of the time the conclusion is that it can’t be done without some serious JS hacking. Here is a workaround which takes a little bit less effort:
First create an extra column containing your ToolTip text and column header like:
'<div title="This text explains the contence of the column">1-01  Revenue  (Sum All)</div>'
image
Set the display format to HTML:
image
Put the result in a pivot table:
image
Till Next Time

Edit: Here is an even quicker method:
http://obieepractice.blogspot.com/2008/11/column-headerooltip-mouse-over.html

Thursday, August 6, 2009

OBIEE TopN versus the rest

Getting a TopN in OBIEE is pretty simple using the rank function:

image

image

But how can we compare this to the rest?

Let’s add an extra column which gives us the rank number if it’s between 1 and 10, else 99.

image

case when RANK("F1 Revenue"."1-01  Revenue  (Sum All)") <= 10 then RANK("F1 Revenue"."1-01  Revenue  (Sum All)") else 99 end

Remove the original filter and check the results:

image

Now add the Customer name to the extra Column:

image

case when RANK("F1 Revenue"."1-01  Revenue  (Sum All)") <= 10 then Cast( RANK("F1 Revenue"."1-01  Revenue  (Sum All)") as char)|| ' - '||"D1 Customer"."C1  Cust Name" else '99 - The Rest' end

Check the results:

image

Now the big trick, switch to pivot table and arrange the columns like this:

image

Till Next Time

Thursday, January 22, 2009

OBIEE rowbased calculations in a pivot table

One of the little known possibilities are the row based calculations in a pivot table. Let's start with a simple report based on the sales sample RPD:

image

image


From this base report we make a simple pivot table:

image

image

In the columns section click on the column properties and select "New Calculated Item"

image

Now can create a rowbased calculation:

image

You can also play with the other functions:

image

Till Next Time

Saturday, December 6, 2008

Saturday, August 16, 2008

OBIEE Stragg function on 10G..

Up to 9i you had to use Tom Kyte's Stragg function to get the children of the level to a single string. From 10GR1 you can use the collect function.

I wrote an entry on my ORACLE101 blog (http://oracle101.blogspot.com/2008/08/oracle-collect-function.html) which can be used in the same way you use the STRAGG function in OBIEE (see: http://obiee101.blogspot.com/2008/08/obiee-children-of-level-converting-rows.html)

Till next time

Wednesday, August 13, 2008

OBIEE Children of the level / Converting rows to strings

1 Preface
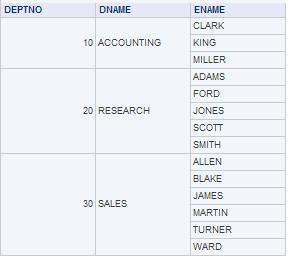
Consider the following table:


But what you really want is this:

Or even better sorted alphabetically

This document describes how you can achieve this in OBIEE against an Oracle DB

2 Stragg function
This solution is based on Tom Kite’s original String Aggregation function found here:
http://www.sqlsnippets.com/en/topic-11591.html

To implement this function in OBIEE your first have to bring the function to the database. Either in the data-schema or in your custom OBIEE function schema. If you do the later be sure that the OBIEE function schema has direct select rights granted on the data-schema tables and views. Grant an execute on the STRAGG function to public. It’s also very handy to create a public SYNONYM for the STRAGG function. (CREATE PUBLIC SYNONYM STRAGG FOR SCHEMA_NAME.STRAGG;)

2.1 The STRAGG scripts

2.1.1 The STRAGG object

create or replace type stragg_type as object
(
string varchar2(4000),

static function ODCIAggregateInitialize
( sctx in out stragg_type )
return number ,

member function ODCIAggregateIterate
( self in
out stragg_type ,
value in varchar2
) return number ,

member
function ODCIAggregateTerminate
( self in stragg_type,
returnvalue out
varchar2,
flags in number
) return number ,

member function
ODCIAggregateMerge
( self in out stragg_type,
ctx2 in stragg_type
)
return number
);
/

2.1.2 The STRAGG type body

create or replace type body stragg_type
is

static
function ODCIAggregateInitialize
( sctx in out stragg_type )
return
number
is
begin

sctx := stragg_type( null ) ;

return
ODCIConst.Success ;

end;

member function ODCIAggregateIterate
( self in out stragg_type ,
value in varchar2
) return number
is
begin

self.string := self.string ',' value ;

return
ODCIConst.Success;

end;

member function ODCIAggregateTerminate
( self in stragg_type ,
returnvalue out varchar2 ,
flags in number
) return number
is
begin

returnValue := ltrim( self.string,
',' );

return ODCIConst.Success;

end;

member function
ODCIAggregateMerge
( self in out stragg_type ,
ctx2 in stragg_type
)
return number
is
begin

self.string := self.string
ctx2.string;

return ODCIConst.Success;

end;

end;
/

2.1.3 The STRAGG function

create or replace function stragg
( input varchar2 )
return varchar2
deterministic
parallel_enable
aggregate using stragg_type
;
/
3 OBIEE Usage
These function work both from the repository as directly from the reports.
3.1 Unsorted

EVALUATE_AGGR( 'STRAGG(%1)' as varchar(200), EMP.ENAME)

3.2 Sorted


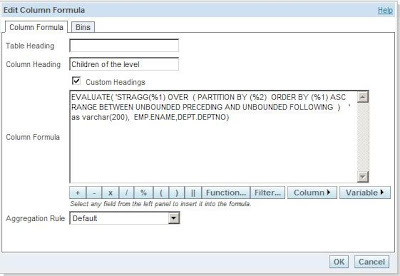
EVALUATE( 'STRAGG(%1) OVER ( PARTITION BY (%2) ORDER BY (%1) ASC RANGE BETWEEN UNBOUNDED PRECEDING AND UNBOUNDED FOLLOWING ) ' as varchar(200), EMP.ENAME,DEPT.DEPTNO)

3.3 Distinct
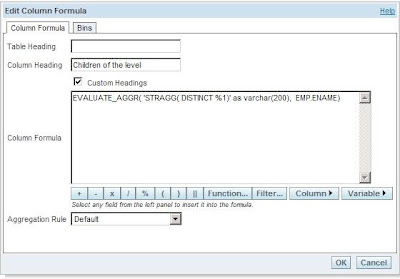
EVALUATE_AGGR( 'STRAGG( DISTINCT %1)' as varchar(200), EMP.ENAME)

Till Next Time

This article was original written for the Ciber knowledge Blog:
http://knowledge.ciber.nl/weblog/?p=125