Showing posts with label NARRATIVE VIEW. Show all posts

Wednesday, February 24, 2010

OBIEE Popup box

Customer wanted to see some extra info in a popup box:

image

This can be done simple from a narrative view:

First start with a basic report:

image

goto the narrative view:

image

Switch on the HTML

in the prefix put:

<tr><th>[b]Customer[/b]</th><th>[b]Revenue[/b]</th></tr>

In the narrative put:

<tr>
<td>@1</td>
<td> <input type="text" onclick="alert('Sum for All Customers: @3!')" value="@2" />
</td>
</tr>

Put it all together on the compound view:

image

Till Next Time

Tuesday, January 19, 2010

OBIEE Google Charts part 2

Impress with real venn diagrams:

image

First get your data:

image

add an extra column with a row count:

image image

Hide it:

image

add an narrative view:

<img src="" id="venn_chart@9"/>  <!-- creates an unique img tag -->
<script type="text/javascript">
var chartURL = "http://chart.apis.google.com/chart?cht=v&chs=200x200&chd=t:@2,@3,@4,@5,@6,@7,@8&chtt=@1&chdl=a|b|c&chdlp=b" ;
/* cht = chart type
   chs = chart size
  chd = chart data
  chtt = chart title
  chdl = chart legend
  chdlp= chart legend position
  more info http://code.google.com/intl/nl/apis/chart/ */

/* get the chart */
document.getElementById('venn_chart@9').src = chartURL;
</script>


Put all together:

image

Till Next Time

This article is also published on http://knowledge.ciber.nl

Friday, August 21, 2009

OBIEE Bing Maps

I showed how to integrate Google Maps into OBIEE. Doing the same with Microsoft Bing maps is slightly different. There service is completely asynchronous, which meant a slightly different approach for the narrative view.

Let’s start with the basics. Get your addresses and a extra column for the array counter. This is just a RCOUNT – 1.

image

image

Switch to a narrative view. In the prefix part put:

<html>
<head>
<title></title>
<meta http-equiv="Content-Type" content="text/html; charset=utf-8">
<script src="http://dev.virtualearth.net/mapcontrol/mapcontrol.ashx?v=6.2"></script>
<script>
var map = null;
var count = 0;
var adr = new Array();
var cmt = new Array();
var Center = new VELatLong(52, 6);
var ZoomLevel = 7;
function GetMap()
{

in the narrative put:
adr[@1]="@3";cmt[0]="@2";

In the postfix part put:

map = new VEMap('myMap'); map.LoadMap();
map.SetCenterAndZoom(Center, ZoomLevel);
FindLocation(adr[0]);

}

function FindLocation(searchstr)
{
if (searchstr != '')
{
map.Find(null, searchstr, null, null, null, null, false, null, null, false, AddPin);
}
}

function AddPin(layer, resultsArray, places, hasMore, veErrorMessage)

{
if(places.length > 0)
{
var shape = new VEShape( VEShapeType.Pushpin,places[0].LatLong);
shape.SetTitle(places[0].Name);
//alert(comments[count]);
shape.SetDescription(cmt[count]);
map.AddShape(shape);
map.SetCenterAndZoom(Center, ZoomLevel);
}
count++;


if(count<adr.length)
FindLocation(adr[count]);
}
</script>

</head> <script src="http://code.jquery.com/jquery-latest.js" type="text/javascript"></script>
<script type="text/javascript">
$(document).ready( function(){GetMap();return false;
}

);

</script>
<body> <div id='myMap' style="position:relative; width:800px; height:600px;"></div> </body>

Don’t forget to set Contains HTML:

image

Add it to the compound Layout:

image

I personally find this webservice slower then the one from Google, but maybe some better coding could fix that. If you have any ideas, please let me know.

Till Next Time

Tuesday, March 17, 2009

OBIEE Google Maps Multiple Addresses

Based on a previous posting (http://obiee101.blogspot.com/2008/10/obiee-using-google-maps-q-style.html) I was asked if it's possible to add multiple addresses to a Google map. Actually this even simpler then having to create a separate map for each address.

Let's get our base table:

image

Now create a narrative view:

image

In the Prefix part put:

// Set the Google maps api key:
<script src="http://maps.google.com/maps?file=api&v=2&key=ABQIAAAAtgh-ZliBar5ci3sjZR_oGRSEtwgT_n0GADCjO95K9FWMY2XE2RQZwN8F1TggjSu117aG70pYMI0GfQ type="text/javascript"></script>

<script type="text/javascript">
// Declarations
var map = null;
var geocoder = null;
var marker = null;

function initialize() {
if (GBrowserIsCompatible()) {
// Create the map
map = new GMap2(document.getElementById("map_canvas"));
// Set the center without markers; 13 is the zoom level
map.setCenter(new GLatLng(37.4419, -122.1419), 13);
// Add the compass and zoom control
map.addControl(new GLargeMapControl());
// Add the Map type control
map.addControl(new GMapTypeControl());
// Get a new geocoder (needed to convert adresses to coordinates
geocoder = new GClientGeocoder();
// Get the ICON for the marker
icon0 = new GIcon();
icon0.image = "http://www.google.com/mapfiles/marker.png
icon0.shadow = "http://www.google.com/mapfiles/shadow50.png
icon0.iconSize = new GSize(20, 34);
icon0.shadowSize = new GSize(37, 34);
icon0.iconAnchor = new GPoint(9, 34);
icon0.infoWindowAnchor = new GPoint(9, 2);
icon0.infoShadowAnchor = new GPoint(18, 25);
// Get the Adresses
GetMapAdress ()
}
}

function showAddress(address,comment) {
// Coverts adresses to coordinates and set the marker on the chart
if (geocoder)
{
geocoder.getLatLng
(
address,
function(point)
{
if (!point)
{
alert(address + " not found");
}
else
{
map.setCenter(point, 13);
var marker = createMarker(point,icon0,comment);
map.addOverlay(marker);
// Opens the last marker
marker.openInfoWindowHtml(comment);
}
}
);
}
}
function createMarker(point, icon, popuphtml)
// Creates the marker
{
var popuphtml = "<div id=\"popup\">" + popuphtml + "<\/div>";
var marker = new GMarker(point, icon);
GEvent.addListener(marker, "click", function() {marker.openInfoWindowHtml(popuphtml);});
return marker;
}

function GetMapAdress ()
{

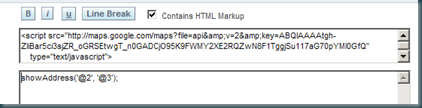
In the narrative part:

// From here it's build dynamicly in OBIEE
showAddress('@2', '@3');

In the Postfix part:

}

</script>
<body onload="initialize();return false" onunload="GUnload()">
<div id="map_canvas" style="width: 600px; height: 400px"></div>
</body>
</html>

No check if it works in the compound layout:

image

Till Next Time

Edit if you are using IE you migth want to look also here:

http://obiee101.blogspot.com/2009/07/obiee-google-maps-alternative-ending.html

Saturday, September 13, 2008

OBIEE Title View

In one of my earlier enrties: http://obiee101.blogspot.com/search/label/NARRATIVE%20VIEW I told that you are restricted in the in the usage of variables of in Title views.
On searching the net I found this document: http://blogs.oracle.com/siebelessentials/oracle%20bi%20ee%20variables%20overview.pdf which triggered me to revisit the subject.
It seems that using the biServer.variables prefix gives you a far more control, allowing you to use all your repository and sessions variables.

@{biServer.variables['NQ_SESSION.USER']}
@{biServer.variables['BI_EE_HOME']},

Till Next Time

Wednesday, February 6, 2008

OBIEE Adding session variables to the report title / using a narrative view

A lot of times we find in the request for reports "please put the value of the used report variables in the title".
But when you try that you quickly run into trouble. By default you are confined to only the predefined ones:

From the OBIEE documentation:
To show your own defined variables (repository/session/presentation) in OBIEE you have to use the narrative view.
First you have to add the variable(s) to your query:


Then alter the column properties, set the column hide property.


Next open a Narrative view, set your descriptive text, the variables are referenced by there a @ and there column number (in this case 2)


Set the rows to display to 1

Reorganize your compound lay-out so that your narrative view is directly below your title


Till Next Time

Sometimes you stand corrected see: http://obiee101.blogspot.com/2008/09/obiee-title-view.html