Wednesday, January 30, 2008

OBIEE Calculate YearWeek and YearWeekAgo

Dates in a datamodel are not always captured in a DateTime dimension. If you need to convert a date to YearWeek (YYYYWW) or to a previous YearWeek, consider this one

cast(year(timestampadd(SQL_TSI_WEEK,0,measuredate)) as
char(4)) right('0' trim( cast(week(timestampadd(SQL_TSI_WEEK,0,measuredate)) As char(2))),2)


If you change the 0 to -1 you get a YearWeekAgo (or 2,3,4)

other intervals are:
  • SQL_TSI_SECOND
  • SQL_TSI_MINUTE
  • SQL_TSI_HOUR
  • SQL_TSI_DAY
  • SQL_TSI_WEEK
  • SQL_TSI_MONTH
  • SQL_TSI_QUARTER
  • SQL_TSI_YEAR

Till Next Time

Tuesday, January 29, 2008

OBIEE backing up repository

When developing you sometimes need to go back in time. Developers have a natural tendency to forget checking in there work properly, SourceSafe safe systems have a tendency to crash.....
During a recent project I installed this simple script on all development machines and simple have it run every hour by a scheduler.

Stampme.cmd:

@ECHO off
SETLOCAL
IF [%1] NEQ [] goto s_start
:: Author - Simon Sheppard, July 2003
:: Tested for Windows NT, 2K, XP
:: Adapted by John Minkjan, January 2008 Ciber
ECHO STAMPME.cmd
ECHO Copy to a backup directory
ECHO and rename a file with the DATE/Time
ECHO.
ECHO SYNTAX STAMPME sh.rpd
ECHO.
:: To change the filename format just change around the last line below
GOTO :eof
:s_start
SET
_file=%~n1%
SET _pathname=%~f1%
SET _ext=%~x1%
::Get the date
:: note ISO 8601 date format would require 4 digit YYYY Year)
FOR /f "tokens=6-8
delims=/ " %%G IN ('NET TIME \\%computername%') DO (
SET _mm=%%G
SET
_dd=%%H
SET _yy=%%I
)
:: Get the time
FOR /f "tokens=1,2 delims=: "
%%G IN ('time/t') DO (
SET _hr=%%G
SET _min=%%H
)
copy "%_pathname%"
".\backup\%_file%-%_yy%-%_mm%-%_dd%@%_hr%-%_min%%_ext%"

Till Next Time

Thursday, January 24, 2008

OBIEE Restricting data based on User Group

One way of doing this is by making a “calculated measure”
FI:
CASE WHEN LOCATE('GROUP_NAME', VALUEOF(NQ_SESSION."GROUP")) > 0 THEN
MyBM.”SomeColumn” ELSE '-' END

The reason for using LOCATE is that
NQ_SESSION."GROUP" returns a comma separated string with all the groups a user belongs to fi: “Everyone;GROUP_NAME”Till Next Time

OBIEE 10.1.3.3.2 availble on OTN

Discovered this morning that version 10.1.3.3.2 is available on OTN. A quick scan of the documentation gives only small patches, mostly in the documentation.

It is still not possible to send DATE/TIME ranges to graphs….

Till Next Time

Tuesday, January 22, 2008

OBIEE Graphs Gradient Effect


The default graph type are rather plain a simple 'professional' effect can be created by playing around with the gradient effect in the PCXML file:

<-Chart Version='4.30.00' BorderType='None' Width='491' Height='295' BGGradientColor='#ccccff' GradientType='BottomTop' >
possible types are:
  • BottomTop
  • TopBottom
  • LeftRight
  • RightLeft

Till Next Time

Thursday, January 17, 2008

OBIEE adding a customized graphtype

One of our customers had the need for some extra customized graphtypes in answers. It took me a while to figure out how OBIEE connects but here is how we did it.


  1. In the map {OracleBI}\web\app\res\s_oracle10\popbin make a copy of the PCXML for the graphtype you want customize.

  2. rename the file [FI:bubble2.pcxml]

  3. Open the file and make the custyomistions you want

  4. In the map {OracleBI}\web\app\res\s_oracle10\charts make a copy of the CXML for the graptype you want to customize.

  5. rename the file [FI:bubble2.cxml]

  6. open the file and edit in sawc:template => displayNameRef="kmsgChartCustomBubble"

  7. edit in sawc:seriesRules => displayNameRef="kmsgBubbleCustomSeries"
  8. edit in sawc:engineSpecific file="popbin/bubble2.pcxml"

  9. Save and close the file.

  10. Next we have edit the messages !you have to this for every language you use! (remember to back it up, else you loose it after every (re-)install/update of OBIEE) [EDIT: or make a custommessage folder for each language] go to {OracleBI}\web\msgdb\l_en\messages

  11. open "chartmessages.xml" and add the entry <-WebMessage name="kmsgBubbleCustomSeries"><-TEXT>Bubble - Custom

  12. Save and close the file

  13. open "charviewmessages.xml" and add the entry <-WebMessage name="kmsgChartCustomBubble"><-TEXT>Bubble - Custom

  14. Save and close the file

  15. restart the Java-host and the prestationserver.

note: replace "<-" with "<"


Till Next Time


Wednesday, January 16, 2008

OBIEE X,Y and data in mouse over label

One of our custumers wants not only the data value in the mouse over label but als the X and Y axis value.

You can achieve this by editing the ".PCXML" for the graph type.


%_BUBBLE_VALUE=> The value for the bubble item. [bubble]
%_CATEGORY_NAME => The name of the category that the data item belongs to. [All, except, X-Y and Time Plot]
%_CATEGORY_TOTAL => The sum of all data values in the category to which the data item belongs. [Area, Bar, Line, Pareto, Pie, Radar]
%_CLOSE_VALUE => The close value for a high-low data item. [Stock]
%_GRAPH_TOTAL => The sum of all data values in a bar, line, pie, or radar graph. [Area, Bar, Line, Pareto, Pie, Radar]
%_HIGH_VALUE => The high value for a high-low data item. [Stock]
%_LOW_VALUE => The low value for a high-low data item. [Stock]
%_OPEN_VALUE => The open value for a high-low data item. [Stock]
%_PERCENT_OF_CATEGORY => The data value represented as a percentage of the sum of all data values in its category. [Area, Bar, Line, Pareto, Pie, Radar]
%_PERCENT_OF_TOTAL => The data value represented as a percentage of the
sum of all data values in the graph. [Area, Bar, Line, Pareto, Pie, Radar]
%_SERIES_NAME => The name of the data series that the data item belongs to. [All]
%_TIME_VALUE => The time value for a Time Plot data item. [Time Plot]
%_VALUE => The value of the data item. [Area, Bar, Line, Pareto, Pie, Radar]
%_XVALUE => The x value for an X-Y data item. [X-Y]
%_YVALUE => The y value for an X-Y or Time Plot data item. [X-Y, Time Plot]


You can find the ".PCXML" files here: {OracleBI}\web\app\res\s_oracle10\popbin or {OracleBI}\web\app\res\s_Siebel77\popbin

look for
<- DataLabels Font='Size:9;Style:Bold;' TransparentBackground='False' BGColor='#FFFFFFcd' BorderColor='#EEEEEE' FormatString='%_BUBBLE_VALUE'/>
After editing you have to restart the java host and the presentation service.

Till Next Time

OBIEE Corda Popchart Example

A customer asked me to demonstrate the default "CORDA" graph types availible in OBIEE to insert into a dashboard. After a lot of ctrlC and ctrlV if made this HTML page for future reference. (You have to run it on your OBIEE / CORDA server)

graph_type_samples.zip

Till Next Time

OBIEE Corda Popchart

If you want to use the examples for the Corda Popchart Engine in OBIEE you first have to register a DLL .
The script is called "installCOMEmbedder.bat" can be found here:
?:\OracleBI\corda50\bin

Till Next Time

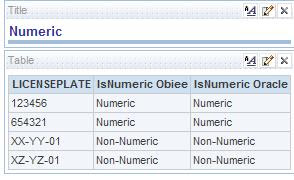
OBIEE IsNumeric

I was searching for an 'IsNumeric' function in OBIEE and couldn't find it so I wrote two alternatives. If anybody has better suggestions feel free to report them!

(the report builders didn't have the proper authorisation to make there own dbFunctions)

Version 1 (all OBIEE):

CASE WHEN
LENGTH(TRIM(REPLACE(REPLACE(REPLACE(REPLACE(REPLACE(REPLACE(REPLACE(REPLACE(REPLACE(REPLACE(REPLACE(REPLACE(REPLACE(TBLTRUCKS.LICENSEPLATE,'1','
'),'2', ' '),'3', ' '),'4', ' '),'5',' '),'6', ' '),'7',' '),'8',' '),'9','
'),'0',' '),'+',' ' ),'-',' '),'.',' '))) <> 0 THEN 'Non-Numeric' ELSE
'Numeric' END

Version 2 (Doing it on the database):


CASE WHEN EVALUATE('LENGTH(TRIM(TRANSLATE(%1,%2,%3)))' AS DOUBLE PRECISION,
TBLTRUCKS.LICENSEPLATE, '+-.0123456789', ' ' ) IS NULL THEN 'Numeric' ELSE
'Non-Numeric' END

Until next time....

Friday, January 11, 2008

OBIEE using oracle stored procedure to fill report

Oracle stored procedures by default don't return recordsets, but sometimes a query is to slow or complex. Especially if it contains multiple outerjoins or complex statistical calculations. (yes, if know how to handle table types there is an other workaround see: http://asktom.oracle.com/pls/asktom/f?p=100:11:0::::P11_QUESTION_ID:666224436920  )

In this demo I will show you a workaround. First you need to tables, one for the parameters and one for the resultset.


CREATE TABLE SH.DEMOPAR
( ID NUMBER, SDATE DATE DEFAULT trunc(sysdate
- 183), EDATE DATE DEFAULT
trunc(sysdate), MACHINENUMBER VARCHAR2(30 BYTE) )
;

CREATE
UNIQUE INDEX SH.DEMOPAR_PK ON SH.DEMOPAR (ID) ;
CREATE
TABLE SH.DEMODATE
(ID NUMBER, MDATE DATE, VALUE NUMBER, INTERPOL NUMBER, C1
NUMBER, C2 NUMBER ) ;
CREATE UNIQUE INDEX SH.DEMODATE_PK ON SH.DEMODATE
(ID, MDATE) ;

For the parameter table you need to construct an XML file for the write-back functionality:

-<-webmessagetables sawm="com.siebel.analytics.web/message/v1">
-<-webmessagetable lang="en-us" table="Messages" system="WriteBack">
-<-webmessage name="demosavepar">
-<-XML>
-<-writeBack connectionPool="CP_dateDemo">
-<-insert>INSERT
INTO DEMOPAR VALUES('@{c0}','@{c1}','@{c2}','@{c3}')
-<-update>UPDATE DEMOPAR SET SDATE = '@{c1}',EDATE =
'@{c2}',MACHINENUMBER = '@{c3}' WHERE ID= '@{c0}'
-<-/writeBack>
-<-/XML>
-<-/webmessage>
-<-/webmessagetable>
-<-/webmessagetables>


Alter the "-<-" in "<" and place the file in ?:\{OracleBI}\web\msgdb\customMessages. Next restart the presentation server. Add both tables to two separate connection pools in your repository! Be sure the cache is off.

Make one report for the parameter table and add the write-back functionality.
Next go to the connection pool for your datatable and open the "Execute before query" tab:


Here you can put your script to execute the stored procedure:
Now you can put both reports on a dashboard!
Till next time