Showing posts with label MAPS. Show all posts

Saturday, June 26, 2010

OBIEE Google map redux

What @Alex does in Siebel: http://siebel-essentials.blogspot.com/2010/06/google-maps-encore-again-nochmal.html, can of course be done in OBIEE.

Just create a narrative constructing the URL:

image

don’t make it to long (say 25 addresses) :

image

and of course don’t forget the contians HTML checkbox:

image

And he presto:

image

or wait for 11g to do some real spatial stuff…

till next time

Saturday, January 16, 2010

OBIEE Google Charts part 1

or how to get from:

image

to this:

image

in 5 minutes.

It uses the same technique we used with the googlemaps. Create a new narrative view.

In the prefix part put:

<!--Get an empty map-->
<img src="http://chart.apis.google.com/chart?cht=t&chm=europe&chs=440x220" id="GD_mapImg"/>
<!--chm ==> geographical area (africa, asia, europe, middle_east, south_america, usa, world)-->
<!--chs ==> canvas size max 440X220-->
<!--more info http://code.google.com/intl/nl/apis/chart/ -->

<script type="text/javascript">
  // setting up parameters
  var chartURL = "http://chart.apis.google.com/chart?cht=t&chtm=europe&chs=440x220&chds=1,6";
  var chartBGColor = "&chf=bg,s,EAEAEA";

  //specify the gradient: <default color>, <start of gradient>,.., <end of gradient>
  var chartPalette = "&chco=AEF5EB,EFE6CE,DFAE6B,1F6913,D94801,A63603,7F2704";

  var chartDataLabels = new Array();
  var chartData = new Array();


In the Narrative part put:

// Use the push command to fill the array:
chartDataLabels.push('@1');
chartData.push(@3);


In the postfix part put:

  // putting it all together
  chartURL = chartURL + chartBGColor + chartPalette + "&chld=" + chartDataLabels.toString().replace(/,/g,'') + "&chd=t:" + chartData.toString();;
  // now get the image from Google Chart
  document.getElementById('GD_mapImg').src = chartURL;
</script>


Remember to check the HTML box:

image

There are maps for africa, asia, europe, middle_east, south_america, usa and the world. For more info see: http://code.google.com/intl/nl/apis/chart/

Till Next Time

This article is also published on http://knowledge.ciber.nl

Friday, August 21, 2009

OBIEE Bing Maps

I showed how to integrate Google Maps into OBIEE. Doing the same with Microsoft Bing maps is slightly different. There service is completely asynchronous, which meant a slightly different approach for the narrative view.

Let’s start with the basics. Get your addresses and a extra column for the array counter. This is just a RCOUNT – 1.

image

image

Switch to a narrative view. In the prefix part put:

<html>
<head>
<title></title>
<meta http-equiv="Content-Type" content="text/html; charset=utf-8">
<script src="http://dev.virtualearth.net/mapcontrol/mapcontrol.ashx?v=6.2"></script>
<script>
var map = null;
var count = 0;
var adr = new Array();
var cmt = new Array();
var Center = new VELatLong(52, 6);
var ZoomLevel = 7;
function GetMap()
{

in the narrative put:
adr[@1]="@3";cmt[0]="@2";

In the postfix part put:

map = new VEMap('myMap'); map.LoadMap();
map.SetCenterAndZoom(Center, ZoomLevel);
FindLocation(adr[0]);

}

function FindLocation(searchstr)
{
if (searchstr != '')
{
map.Find(null, searchstr, null, null, null, null, false, null, null, false, AddPin);
}
}

function AddPin(layer, resultsArray, places, hasMore, veErrorMessage)

{
if(places.length > 0)
{
var shape = new VEShape( VEShapeType.Pushpin,places[0].LatLong);
shape.SetTitle(places[0].Name);
//alert(comments[count]);
shape.SetDescription(cmt[count]);
map.AddShape(shape);
map.SetCenterAndZoom(Center, ZoomLevel);
}
count++;


if(count<adr.length)
FindLocation(adr[count]);
}
</script>

</head> <script src="http://code.jquery.com/jquery-latest.js" type="text/javascript"></script>
<script type="text/javascript">
$(document).ready( function(){GetMap();return false;
}

);

</script>
<body> <div id='myMap' style="position:relative; width:800px; height:600px;"></div> </body>

Don’t forget to set Contains HTML:

image

Add it to the compound Layout:

image

I personally find this webservice slower then the one from Google, but maybe some better coding could fix that. If you have any ideas, please let me know.

Till Next Time

Saturday, August 15, 2009

OBIEE Google Maps linebreak in annotations

I was asked how to get from
to this:


The problem is that the presentation server converts the HTML br symbol to htmltext (& g t) so the google maps api doesn't regonise it.

This can be bypassed by using the javascript replace command:

comment.replace(/, /g," ,<> "));


(without the spaces)

the code to create the marker now would look like this:

var marker = createMarker(point,icon0,comment.replace(/, /g," <> "));


Till Next Time

Sunday, July 26, 2009

OBIEE Google Maps an alternative ending

In these articles:

I showed you how to integrated Google maps in OBIEE. Some of you got into trouble when using it on dashboard with a Microsoft Internet Explorer. This is caused by the fact that IE doesn’t like multiple .onload events in a frameset.

Here is an alternative. In the postfix part of the narrative use this instead:

}
</script>
<script src="http://code.jquery.com/jquery-latest.js" type="text/javascript"></script>
    <script type="text/javascript">
        $(document).ready( function(){initialize();return false;
            }
        );
    </script>

<body onunload="GUnload()">
     <div id="map_canvas" style="width: 600px; height: 400px"    > </div>
</body>

If your organisation doesn’t allow a live connection to the internet download the jquery JS script from here:

Put it in a custom folder named res/my_custom_js as change the source to:

  • <script src="res/my_custom_js/jquery.js" type="text/javascript"></script>

(Sync with the OC4J folder if needed)


Till Next Time

Tuesday, March 17, 2009

OBIEE Google Maps Multiple Addresses

Based on a previous posting (http://obiee101.blogspot.com/2008/10/obiee-using-google-maps-q-style.html) I was asked if it's possible to add multiple addresses to a Google map. Actually this even simpler then having to create a separate map for each address.

Let's get our base table:

image

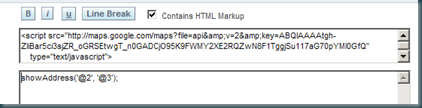
Now create a narrative view:

image

In the Prefix part put:

// Set the Google maps api key:
<script src="http://maps.google.com/maps?file=api&v=2&key=ABQIAAAAtgh-ZliBar5ci3sjZR_oGRSEtwgT_n0GADCjO95K9FWMY2XE2RQZwN8F1TggjSu117aG70pYMI0GfQ type="text/javascript"></script>

<script type="text/javascript">
// Declarations
var map = null;
var geocoder = null;
var marker = null;

function initialize() {
if (GBrowserIsCompatible()) {
// Create the map
map = new GMap2(document.getElementById("map_canvas"));
// Set the center without markers; 13 is the zoom level
map.setCenter(new GLatLng(37.4419, -122.1419), 13);
// Add the compass and zoom control
map.addControl(new GLargeMapControl());
// Add the Map type control
map.addControl(new GMapTypeControl());
// Get a new geocoder (needed to convert adresses to coordinates
geocoder = new GClientGeocoder();
// Get the ICON for the marker
icon0 = new GIcon();
icon0.image = "http://www.google.com/mapfiles/marker.png
icon0.shadow = "http://www.google.com/mapfiles/shadow50.png
icon0.iconSize = new GSize(20, 34);
icon0.shadowSize = new GSize(37, 34);
icon0.iconAnchor = new GPoint(9, 34);
icon0.infoWindowAnchor = new GPoint(9, 2);
icon0.infoShadowAnchor = new GPoint(18, 25);
// Get the Adresses
GetMapAdress ()
}
}

function showAddress(address,comment) {
// Coverts adresses to coordinates and set the marker on the chart
if (geocoder)
{
geocoder.getLatLng
(
address,
function(point)
{
if (!point)
{
alert(address + " not found");
}
else
{
map.setCenter(point, 13);
var marker = createMarker(point,icon0,comment);
map.addOverlay(marker);
// Opens the last marker
marker.openInfoWindowHtml(comment);
}
}
);
}
}
function createMarker(point, icon, popuphtml)
// Creates the marker
{
var popuphtml = "<div id=\"popup\">" + popuphtml + "<\/div>";
var marker = new GMarker(point, icon);
GEvent.addListener(marker, "click", function() {marker.openInfoWindowHtml(popuphtml);});
return marker;
}

function GetMapAdress ()
{

In the narrative part:

// From here it's build dynamicly in OBIEE
showAddress('@2', '@3');

In the Postfix part:

}

</script>
<body onload="initialize();return false" onunload="GUnload()">
<div id="map_canvas" style="width: 600px; height: 400px"></div>
</body>
</html>

No check if it works in the compound layout:

image

Till Next Time

Edit if you are using IE you migth want to look also here:

http://obiee101.blogspot.com/2009/07/obiee-google-maps-alternative-ending.html

Saturday, October 25, 2008

OBIEE using google maps (Q&D style)

While I was waiting for a plane back home on London City Airport, I had some time left...... I thought I digg into how to use Google maps from OBIEE.

Step 1: Get a Google Maps API Key from: http://code.google.com/apis/maps/signup.html

Since the Google maps API uses a key generate based on the IP and name from calling server be sure your on your webserver when calling this. Get a key based on your own OBIEE server adress: http://vmobiee:9704/analytics/

Step 2: Create a report with a at least a combined adress column and an RCOUNT (forget it in the picture):


Step 3: Add a narrative view to report with the following script in the prefix area


?!?script src="http://maps.google.com/maps?file=api&v=2.x&key=ABQIAAAAtgh-ZliBar5ci3sjZR_oGRSEtwgT_n0GADCjO95K9FWMY2XE2RQZwN8F1TggjSu117aG70pYMI0GfQ" type="text/javascript"!?!?!?/script!?! ?!?script type="text/javascript"!?!
var map1 = null; var geocoder1 = null;
function initialize1(address1) { if (GBrowserIsCompatible()) { map1 = new GMap2(document.getElementById(1),{size:new GSize(400,300)}); geocoder1 = new GClientGeocoder(); map1.setCenter(new GLatLng(37.4419, -122.1419), 13); } if (geocoder1) { geocoder1.getLatLng( address1, function(point1) { if (!point1) { alert(address1 + " not found"); } else { map1.setCenter(point1, 13); map1.addOverlay(new GMarker(point1));
} } ); } }
var map2 = null; var geocoder2 = null;
function initialize2(address2) { if (GBrowserIsCompatible()) { map2 = new GMap2(document.getElementById(2),{size:new GSize(400,300)}); geocoder2 = new GClientGeocoder(); map2.setCenter(new GLatLng(37.4419, -122.1419), 13); } if (geocoder2) { geocoder2.getLatLng( address2, function(point2) { if (!point2) { alert(address2 + " not found"); } else { map2.setCenter(point2, 13); map2.addOverlay(new GMarker(point2));
} } ); } }
var map3 = null; var geocoder3 = null;function initialize3(address3) { if (GBrowserIsCompatible()) { map3 = new GMap2(document.getElementById(3),{size:new GSize(400,300)}); geocoder3 = new GClientGeocoder(); map3.setCenter(new GLatLng(37.4419, -122.1419), 13); } if (geocoder3) { geocoder3.getLatLng( address3, function(point3) { if (!point3) { alert(address3 + " not found"); } else { map3.addOverlay(new GMarker(point3));map3.setCenter(point3, 13); } } ); } }
?!?/script!?! ?!?/head!?!
Replace ?!? and !?! with tag symbols

This code is for max 3 maps on a page but easily extenbel to any higher number.

More info on the google map API http://code.google.com/apis/maps/documentation/examples/

In the narrative part add


:?!?div id="@7" style="width: 400px; height:
300px;text-align:center;"!?! ?!?script type="text/javascript"!?! initialize@7('@6') ?!?/script!?!
?!?/div!?!@1, @6

Where @7 is the rcount column and @6 is the google adress.

Now put it all on the dashboard:


Till Next Time
Edit if you are using IE you migth want to look also here:
http://obiee101.blogspot.com/2009/07/obiee-google-maps-alternative-ending.html