Wednesday, December 19, 2007

OBIEE Scale markers

According to the documentation you can set a scale marker based on a column value.

[quote]Options for these values include a static value, a variable, a value
sourced from a column included in the request, or one derived from a SQL
query.
Advanced options enables you to dynamically set values based on
results of a
column, query, or presentation variable which is evaluated
while rendering the
chart as follows.[/quote]
It seems that if a query is very complex (5 union all and some dashboard prompts) you loose the column selector (undocumented feature?).
==>> After futher research I discovered that this feature seems to
be turned on or off based on the availble columntypes. If you make the column an aggragate (SUM,MIN,MAX etc) you can use it directly.... <<==

You can add the scale marker manually by first adding a static marker and then editing the XML directly by replacing the linePosition part:


(saw:linePosition>(saw:columnRef columnID="c59"/> (/saw:linePosition>

( Replace the ( with < )
where "c59" is the column you want to use as a scale marker.

OBIEE Duration between events

OBIEE doesn't have a default GANTT type chart type.


For a customer I developed a simple and crude alternative.
First I get the LAG column and a Dummy column which calculates the total duration in the selection so far:


Then a select a vertical bar graph in which I give the dummy column the same colour as the background:


I know it's crude, but it works, but any better suggestions are welcome.


Thursday, December 13, 2007

OBIEE Default security groups for BI Publisher

If you are using OBIEE and BI Publisher side by side using shared security model (XDO), you wil need to create some default users groups:


These groups are used by the XMLP server:
  • XMLP_ADMIN
  • XMLP_DEVELOPER
  • XMLP_SCHEDULER
  • XMLP_ANALYZER_EXCEL
  • XMLP_ANALYZER_ONLINE
  • XMLP_TEMPLATE_DESINGER

If you are working with multi user repository development remember to assign the groups at least to one project, or the group will be lost at check in.

Tuesday, December 11, 2007

OBIEE Excel and slashes

Just a tip from my (time costly) experience when using the Excel plug-in. Try to avoid the '/' - forward slash (fi: costs / hr) in column names . Excel has sometimes trouble handling those columns if the column name is used in further (VBA) scripting. Basically it not a good idea to use any mathematical signs (+-/*^%#&) in a column name.

OBIEE empty presentation tables in a repository in a multi-user environment

If you check in a repository in a multi-user environment, you will notice that it doesn't accept empty presentation tables, which you might use for table indentation.

One solution is to using a dummy column:

To make it invisible for the other users you can make a special user HideColumn:


And set the persions only for this user:

This way OBIEE checks in and out without any problems.


Monday, December 10, 2007

OBIEE referencing session variables in report title

After spending way to much time figering out the exact lingo, I decided to blog them for futher reference:
  • currentTime => @{system.currentTime}
  • system.productVersion => @{system.productVersion}
  • session.locale => @{session.locale} = en-gb
  • session.language => @{session.language} = en
  • rtl =>@{session.rtl} = false
  • session.loginTime => @{session.loginTime}
  • session.logoutTime =>@{session.logoutTime }
  • session.lastAccessTime =>@{session.lastAccessTime}
  • session.currentUser => @{session.currentUser.id} = administrator
  • user.homeDirectory => @{user.homeDirectory} = /users/administrator
  • user.id => @{user.id} = administrator
  • user.displayName => @{user.displayName} = administrator

Friday, December 7, 2007

OBIEE EVALUATE_AGGR Function

In the documentation for OBIEE 10.3.3.1 you find a very small description of the EVALUATE_AGGR function:

6.2 EVALUATE_AGGR Function
This function is intended for aggregate functions
with group by clause.
Syntax: EVALUATE_AGGR('DB_Aggregate_Function(%1)',
{comma separated Expression})
Example: SELECT year.year, sales.qtysold, EVALUATE_AGGR('sum(%1)', sales.quantity) From SnowFlakeSales;


This function is very useful if you want to use the build in statistics functions from the ORACLE database like:

  • CORR
  • COVAR_POP
  • STDDEV_POP

The following example calculates the coefficient of correlation between the list prices and minimum prices of products by weight class in the sample view oe.products:SELECT weight_class, EVALUATE_AGGR('CORR(%1,%2)' as double, product_information.list_price, product_information.min_price)
FROM product_information;

If you get a "[38083] The Attribute defines a measure using an obsolete method." error, check whether you set the Aggregation Rule of the logical column correctly.

Good info can also be found here:

http://www.oracle.com/technology/products/bi/pdf/Oracle%20Business%20Intelligence%20Server%20and%20Embedded%20DB%20Functions.pdf


OBIEE EVALUATE Function

In the documentation for OBIEE 10.3.3.1 you find a very small description of the EVALUATE function:


6.1 EVALUATE Function
This function is intended for scalar and analytic
calculations.
Syntax: EVALUATE('DB_Function(%1)', {
Comma separated Expression})
Example: SELECT
e.lastname,sales.revenue,EVALUATE('dense_rank()
over(order by %1
)',sales.revenue) FROM sales s, employee e;

As often in practice the real world is more complex:
Good practice is to tell the EVALUATE function which type of return value it can expect:
EVALUATE('DB_Function(%1)' as returntype, {Comma separated Expression}). If you omit this it might sometimes complain that it can't concatenated values from a different type.

Another trap is when you use columns from several tables for the input variables, be sure that they have a direct join. Else OBIEE will try to join them underwater which can lead to unwanted Cartesian products.

OBIEE Pivot table with carriage return

One of my customers wanted some data presented in a pivot table with a maximum of 5 columns. If more data is available then a sort of carriage return should be given and continue on next line. (A sort of DTP)

First I concatenated all the data into 1 cell:


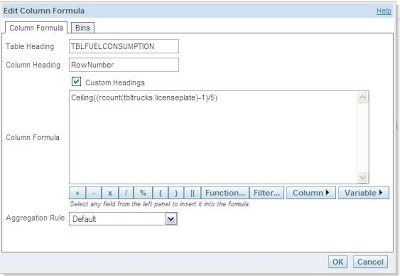
Then I determined the ColomnNumber and RowNumber for each element.


And finally put it in a pivot table:


Don't forget to set the aggregate level for the measure to first!

Thursday, December 6, 2007

OLAP 101

Found this blog entry:

Part I:
http://oraclebi.blogspot.com/2007/11/olap-workshop-basic-overview-of-olap.html
part II:
http://oraclebi.blogspot.com/2007/11/olap-workshop-part-2-understanding-olap.html
Part III:
http://oraclebi.blogspot.com/2007/12/olap-workshop-part-3-building-analytic.html

Some good basic info examples when you need to talk with customers

OBIEE for MicroSoft Office

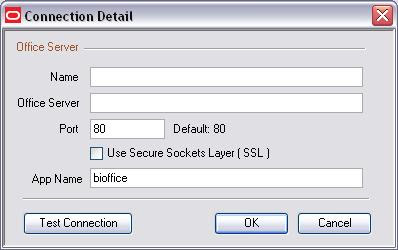
When you try to log on to OBIEE for the first time from Excel, you are asked to define a connection:


The setup documentation and the default settings from OBIEE for MS-Office can put you in the wrong direction.

The port number is the port where your bioffice is running, default this is the same port as your BI-server (default) 9704.

Your connection could look like this:

OBIEE Measures and Events in one chart


Recently I had a question from a customer, a truck management company. They collect electronically statistics from several truck company’s. One statistic is fuel consumption.


The other one is trips to the garage:

Where 1 = Tyre change, 2 = Oil Change, 3= Fuel Filter Change, 4 = Other maintenance.


They want this data combined in one chart, to see if a trip to garage has an influence on the fuel consumption.


First I combined the data into one view using UNION ALL and a couple of dummy columns. If I have an event for that date I put in a 10 else NULL.

Then I put this into a Line Bar Combo Graph


A simple way to combine Measure and Events.

[17-DEC-2007] @George:


This is the date format:


Wednesday, December 5, 2007

OBIEE EVALUATE function and presentation variables

I have this function defined in a report:
evaluate('bi_server.fnc_XXX_l_ind (%1,%2)' as varchar(250),@{MACHINEID}{'1234'}
,@ {PTESTCODE}{'X56GH'})

both %1 and %2 are varchar

When I put the report in a dashboard and try to fill the presentation values the report comes back with:

[nQSError: 27005] Unresolved column: "X56GH". (HY000)

The reason for this error is that is't trying to use the column "X56GH" instead of the string "X56GH".

The solution is to put single quotes around the presention variables:
evaluate('bi_server.fnc_XXX_l_ind (%1,%2)' as varchar(250),'@{MACHINEID}{1234}','@{PTESTCODE}{X56GH}')

But not around the default values!

OBIEE Dummy Column with NULL value

Sometimes you need a dummy column in Union (ALL) query's with a NULL value.
Try this =>
CAST(NULL as double)

My First Blog

Wow,

Even I had to go with the flow and create my own blog.
Let me introduce myself...

My name is John Minkjan and I'm a senior BI consultant voor CIBER in the Netherlands.
I use this blog to store all the things I run into when using OBIEE. Mostly to use it as a reminder (how did we to that?). Feel free to send me any comments!