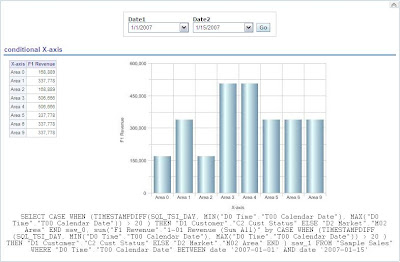
First create the conditonal x-axis: (Sales sample)
CASE WHEN (TIMESTAMPDIFF(SQL_TSI_DAY, MIN("D0 Time"."T00 Calendar Date"), MAX("D0 Time"."T00 Calendar Date")) > 20 ) THEN "D1 Customer"."C2 Cust Status" ELSE "D2 Market"."M02 Area" END
 Next alter the Y value so that it will follow the X - axis:
sum("F1 Revenue"."1-01 Revenue (Sum All)" by CASE WHEN
(TIMESTAMPDIFF(SQL_TSI_DAY, MIN("D0 Time"."T00 Calendar Date"), MAX("D0 Time"."T00 Calendar Date")) > 20 ) THEN "D1 Customer"."C2 Cust Status"
ELSE "D2 Market"."M02 Area" END )

Add everthing to a dashboard:
15 days:
25 days:

Till Next Time
No comments:
Post a Comment