If you have this request:

You will get a default table view like this:
Let's put it in a pivot table: 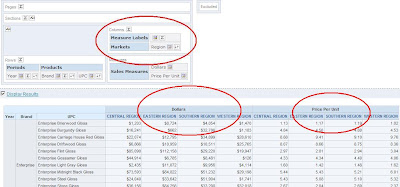
Switch the measure label box with the region:

It becomes even more intressting wen we bring the measure label box to row pane:

 Till Next Time
11 comments:
And how do you sort a pivot table? for example if you add a total column and you want to sort your rows based on that total? I have been looking how to do this and haven't been able to.
Try playing aroun with a (hidden) TOPN column over your measure:
TOPN((sum("Sales Measures".Dollars by Products.Brand)),1000)
regards
John
John,
I created a pivot table and I want to set page breaks, because the resultset is returning too many rows. Is there a way to set a page break on the rows? or if not, is there a way to set up a vertical sliding bar on the page?
Thanks in advance.
Aram Dodakian
Try playing around with:
FLOOR(RCOUNT(1) /10)
It not ideal, but it can be a start.
regards
John,
Have a stacked pivot table with various dimensions on columns such as month and scenario.
How in the above example can I return actual, budget and variance for one month but only budget for the YTD? I can make the column blank by putting a CASE WHEN in the formula but the pivot still includes the column, even though blank.
Any help appreciated.
Thanks
see i have a some doubt that i how icreate a levels in the reports can u give me a solution thrugh the quote
I want to remove the "Blue Cell" which is the column heading for "measure label" want to either put text or want to change background color to white from front and not changing them in the CSS files ,Any Idea?
Thanks
hello, how do you combine two pivot tables with different filters into one report
This is nice john it resolved my problem
Hi all,
I have a pivot table requirement where I have to display the values and % total of few measures in OBIEE 10g.
Assuming there are 3 measure fields Measure1, Measure2, Measure3 from a fact table, below is the format
_"Measure Name"______|___"Values"______|_____"% Total"_______
< measure1 field name> | | <% Total of measure 1>
< measure2 field name> | | <% Total of measure 2>
< measure3 field name> | | <% Total of measure 3>
__________________________________________________________
Grand Total___________|___Total Value____|________ 100%
First row are the titles of the columns.
First Column gives the measure entity name/label, second and third columns give the corresponding Measure's value and % of Total.
I could get the "Values" column work, but could not get the '% Total' to come up in the Pivot.
Is there a better way of implementing this if not a Pivot?
Is there a way to rename different pivot table views we added to composite view.
Post a Comment