WOW: Before you start doing any editing like this BACK UP BACK UP BACK UP. Because if it goes wrong it can really F*#@$">F*#@$ your system.
Step 1: Copy the linetime.cxml file to linetimescatter.cxml. This file can ussaly be found in ..\OracleBI\web\app\res\s_oracle10\charts
Step 2: Copy the timeline.pcxml to timelinescatter.pcxml. This file can ussaly be found in ..\OracleBI\web\app\res\s_oracle10\popbin
Step 3: In the custommessages folder for the language add the following to the custommessages.xml file (create the folder and file if they don't exsist!)


Step 4: Edit the linetimescatter.cxml file
set displaynameref="kmsgChartTimeSeriesScatter"
set sawc:engineSpecific file="popbin/timelinescatter.pcxml"
Save and close the file
Step 5: Edit the timelinescatter.pcxml file
set Graph Name="graph" Type="Time" SubType="Scatter"
Save and close the file
Step 6:
restart the Java-host and the prestationserver.

Till Next Time
9 comments:
Hi John,
i want to display tool tip for level axis in a scattered graph as like hovering over a point it is displaying the X and Y axis value , in the same way i want the actual value of column which has been taken in level axis.
Thanks
Naresh Meda
@Naresh,
Have a look here:
http://obiee101.blogspot.com/2008/01/obiee-xy-and-data-in-mouse-over-label.html
regards
john
Hi Jhon,
%_SERIES_NAME gives us the legend axis value . when i put %_CATEGORY_NAME i did not get any value in the chart rather it showed the text like Z = %_CATEGORY_NAME . Is there any syntax to follow. All other options are not for all the graph . Could you please help me out.
Thanks
Naresh
@Naresh
Did you try %_XVALUE, %_YVALUE , %_BUBBLE_VALUE
regards
john
Hi John,
yes , i tried . but it is not for scattered graph . it's for bubble graph . Still then i tried with that and it displays 0 always.
Thanks
Naresh
@Naresh
Did you check the docs in:
{OracleBI}corda50\docs
regards
John
Hi John,
i went through all the available document but did not get any solution
Thanks
Naresh
Hi John
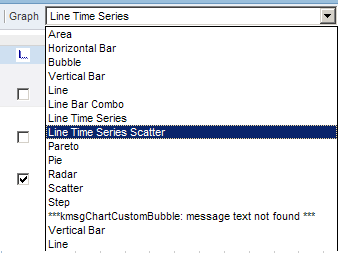
I followed your instructions but in the drop down list i keep getting:
*** kmsgChartTimeSeriesScatter: message text not found ***
any idea on what maybe wrong?
Thanks
@Chris,
Check for typo's and Capitals!
Restart the presentation server and javahost.
regards
Post a Comment